To say May was an eventful month for the market is an understatement. Investors navigated around the latter half of first-quarter earnings, a breakout to record highs for the broader market, elevated volatility across fixed income and currency markets, and a mixed bag of economic data — not to mention elevated political uncertainty stemming from the conviction of former President Donald Trump. Overall, markets shrugged off political uncertainty, bad economic data was mostly taken as good news for stocks by reviving hope for interest rate cuts, while good news helped write the goldilocks narrative of economic conditions being just right.
MAY FLOWERS BEGIN TO WILT
Despite the S&P 500 capping off the month by ending its five-week winning streak, the index still added around 5% in May and posted its 24th record high this year. The advance was largely driven by a handful of mega cap stocks that rallied on strong earnings. In fact, chipmaker NVIDIA (NVDA) contributed to just over one-quarter of the S&P 500’s monthly gain alone.
Technical evidence points to May flowers beginning to wilt. Participation in the latest rally was relatively narrow, with fewer S&P 500 constituents making new 52-week highs or trading above their 200-day moving averages (dma) than when the market last reached new highs back in March. Furthermore, the lack of overbought conditions during the rally created a negative divergence between price and momentum. For example, the S&P 500’s Relative Strength Index (RSI) — a momentum oscillator used to measure the velocity of price action to determine trend strength — failed to reach overbought territory or levels commensurate with prior highs registered earlier this year.
The lack of confirmation from momentum and market breadth during last month’s advance increases the risk of a failed breakout, but it doesn’t mean the bull market is over. Narrow participation in breakouts above key resistance has been characteristic of this bull market (generals lead, soldiers follow). For example, the breakout to new highs in January had fewer stocks trading above their 200-dma or making new highs than in December, while the RSI had also formed a divergence from price action during this period. Rotational forces outside the mega cap space kept the rally going — something we expect will be required again for this market to keep moving higher.
SECTOR CHANGES
The month of May provided more evidence of a slowing but growing economy, easing inflation, albeit at a slower pace than desired, evidence of softening consumer spending, and resilient earnings from corporate America.
Rate cut expectations have been drastically reduced over the last few months, with fed funds futures pointing to the first cut potentially coming by September (only 45% odds for an additional rate cut by December). Given some of the changes to the macro environment and developing fundamental and technical trends, LPL Research’s Strategic and Tactical Asset Allocation Committee (STAAC) made several sector recommendation changes this month, including:
- Upgraded industrials to overweight from neutral.
- Upgraded consumer staples to neutral from underweight.
- Downgraded healthcare to underweight from neutral.
- Downgraded consumer discretionary to underweight from neutral.
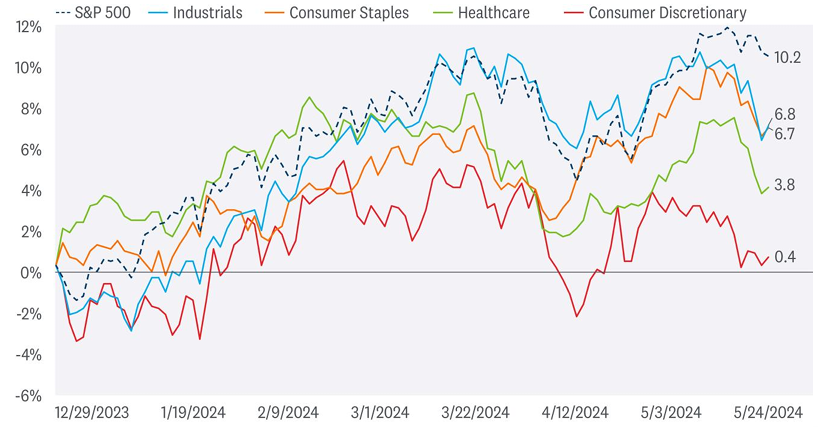
It all comes down to performance, and the consumer discretionary and healthcare sectors have consistently lagged the broader market this year. Higher inflation and interest rates have weighed on the outlook for consumer spending as excess savings have largely been spent, while weakness in the managed care space due to disappointing government Medicare Advantage payments and lower COVID-19-related sales have acted as drags on the broader healthcare sector. Consumer staples have been a growing beneficiary of defensive positioning and a more price-conscious consumer. The industrials sector has largely kept up with the broader market for most of the year, benefiting from increased infrastructure spending, re-shoring activity, and defense spending. Industrials are also a backdoor artificial intelligence (AI) play given their role in data center construction and maintenance.
SELECT SECTOR PERFORMANCE VS. THE S&P 500
Healthcare and Consumer Discretionary Continue to Lag
Source: LPL Research, Bloomberg 05/30/24
Past performance is no guarantee of future results. All indexes are unmanaged and can’t be invested in directly.
IT’S ALL RELATIVE
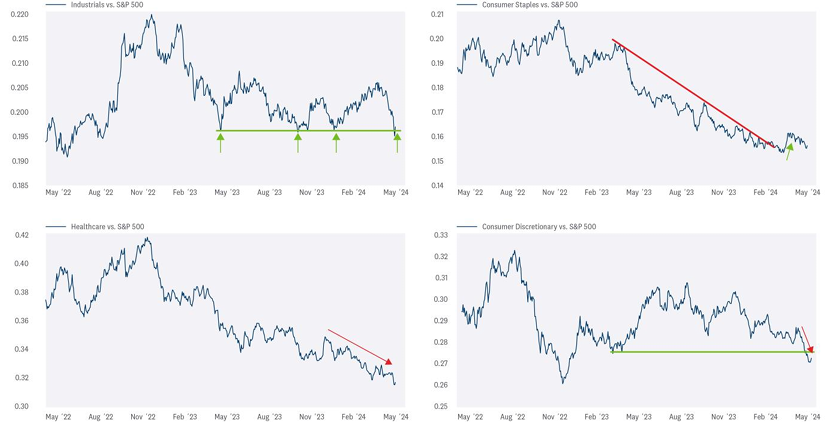
When it comes to asset allocation, identifying relative strength is paramount to delivering alpha. A ratio chart that divides a sector by a benchmark or index provides a simple but effective way to detect trend direction and strength. In the chart below, we compare our recent sector changes to the S&P 500. When the ratio chart is rising, the sector is outperforming the index, and vice versa.
Starting in the top right, the industrials vs. S&P 500 ratio chart has dropped back to key support as the sector gave up some relative strength last month. However, there has been limited technical damage to the broader sector, as longer-term breadth and momentum metrics remain bullish. We consider the recent pullback in industrials as a buying opportunity and expect the relative trend to rebound off its current support level.
Moving to the top right, the consumer staples vs. S&P 500 ratio chart has recently reversed a downtrend after registering a higher low. While there is insufficient technical evidence suggesting consumer staples leadership is now underway, an upgrade to neutral is warranted.
The bottom two charts highlight the ratios of healthcare (bottom left) and consumer discretionary (bottom right) vs. the S&P 500. Both ratio charts remain in downtrends and at fresh year-to-date lows, suggesting their trends of underperformance are likely to continue.
RELATIVE TRENDS ALIGN WITH SECTOR CHANGES
Source: LPL Research, Bloomberg 05/30/24
Past performance is no guarantee of future results. All indexes are unmanaged and can’t be invested in directly.
VALUATION UPDATE
There is a saying on Wall Street that there are plenty of bad times to buy good companies. And while technical analysis can help investors avoid those bad times, understanding a stock or sector’s valuation can provide additional insight into a company’s potential longer-term returns.
The price-to-earnings (P/E) ratio is one of the more common valuation tools utilized to assess how a security is priced in the market. In general, a higher P/E equates to a more expensive stock, and vice versa. However, a P/E multiple in isolation provides little value unless it’s compared to its history and/or its historical valuation spread to another asset.
In the chart below, we highlight each sector’s current forward P/E multiple (using earnings estimates over the next 12 months) and compare it to its average forward P/E from 2015–2019 — this period was used to eliminate pandemic-era distortions. A Z-score statistic was then applied to quantify the current P/E relative to its history.
Perhaps unsurprisingly, the S&P 500 is expensive relative to history, trading with a Z-score of 3.9. However, we believe a premium multiple is justified as earnings potentially broaden beyond large cap tech, AI continues to proliferate, and a soft landing facilitates an eventual Federal Reserve (Fed) rate cut.
As it relates to our sector changes, healthcare and consumer discretionary stand out as expensive, especially given their weak performance. Industrials are also a bit expensive but likely justified when considering the outlook for sustainable infrastructure and defense spending.
MARKET VALUATIONS ARE RUNNING HIGH
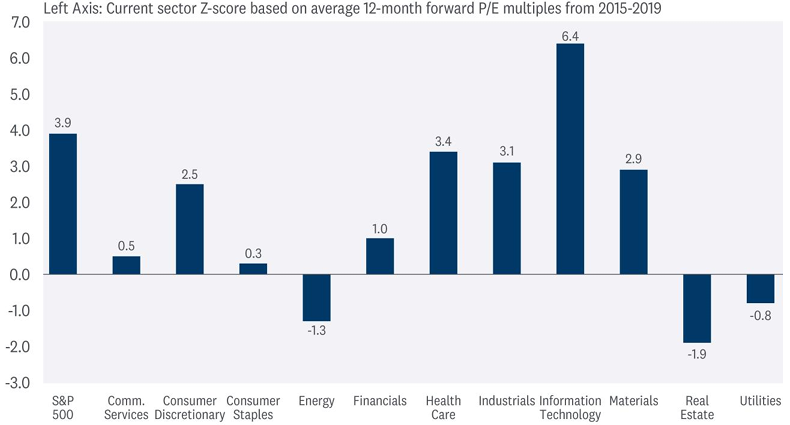
Above zero indicates the sector is trading above its pre-pandemic average forward P/E (higher readings = higher valuation relative to history).
Source: LPL Research, Bloomberg 05/30/24
Past performance is no guarantee of future results. All indexes are unmanaged and can’t be invested in directly.
LOOKING AHEAD TO JUNE
So much for selling in May! The idea of selling stocks in May and buying back into the market when seasonal strength tends to return in November would have been a painful trade this month. The S&P 500 rose 4.8% in May, coming in well above the average May return of only 0.2% since 1950. The rebound back to record highs also completely reversed April’s 4.2% drop. Perhaps April showers bringing May flowers is a better market analogy than “Sell in May and Go Away” — a strategy we contested in our Weekly Market Commentary last month.
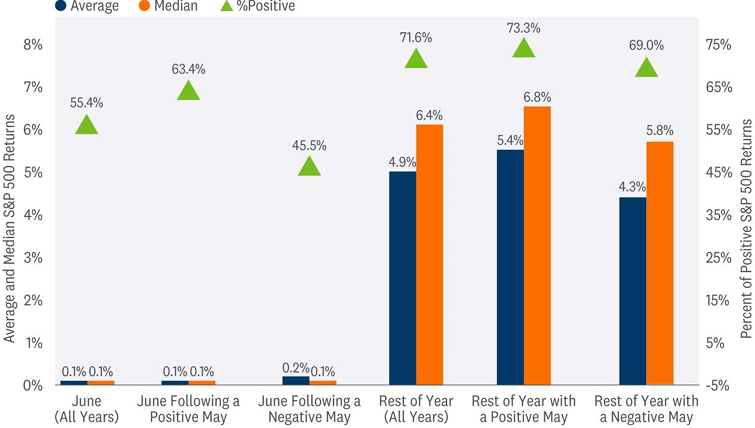
Peeking forward to June, seasonality trends are hardly anything to get excited about. Since 1950, the S&P 500 has generated an average and median June price return of 0.1%, with 55% of months posting positive results. However, for the remainder of the year, the S&P 500 has posted respective average and median returns of 4.9% and 6.4% after May. Returns from June through December also improve when the month of May is positive, with respective average and median returns bumping up to 5.4% and 6.8% (73% of occurrences also posted positive results).
SEASONAL SETUP FOR STOCKS
Source: LPL Research, Bloomberg 05/30/24
Past performance is no guarantee of future results. All indexes are unmanaged and can’t be invested in directly. The modern design of the S&P 500 stock index was first launched in 1957. Performance back to 1950 incorporates the performance of the predecessor index, the S&P 90.
CONCLUSION
The technical analysis picture has started to weaken some after a strong month of May for stocks. A potentially more challenging macro and political environment suggests it may be prudent to shift to a slightly more defensive posture in terms of sector allocations. Valuations are elevated, as we have pointed out numerous times in recent months. But with prospects for a soft landing still favorable as inflation pressures ease, the start of the Fed’s rate-cutting campaign potentially just a few months away, and corporate profits growing nicely, we would not want to turn bearish here.
If companies can deliver near-consensus earnings estimates in 2024, buoyed by big tech, and inflation resumes its downward trajectory, enabling a soft landing, then we believe stocks stand a good chance of adding to year-to-date gains through year-end and hold a P/E ratio over 20. If a slowing economy weighs on earnings in the second half and inflation remains frustratingly sticky, then we would consider fair value for the S&P 500 at year-end to be closer to our original projection in the 4,850 to 4,950 range.
ASSET ALLOCATION INSIGHTS
LPL’s Strategic and Tactical Asset Allocation Committee (STAAC) maintains its tactical neutral stance on equities. Steady economic and earnings growth this year has kept the risk-reward trade-off for stocks and bonds fairly well balanced, but moving forward, with valuations for stocks elevated and bonds offering more attractive yields, we believe bonds hold a slight edge over stocks. Strong year-to-date stock market gains may have pulled forward some potential gains from Fed rate cuts, potentially leaving limited upside and more volatility over the balance of 2024 as the economy potentially slows.
Within equities, the STAAC continues to favor a tilt in the Tactical Asset Allocation (TAA) toward domestic over international equities, with a preference for Japan among developed markets, and an underweight position in emerging markets (EM). The Committee recommends a very modest tilt toward the growth style after reducing its overweight position in mid-March, in favor of adding small caps to remove that underweight position. Finally, the STAAC continues to recommend a modest overweight to fixed income, funded from cash.
IMPORTANT DISCLOSURES
This material is for general information only and is not intended to provide specific advice or recommendations for any individual. There is no assurance that the views or strategies discussed are suitable for all investors or will yield positive outcomes. Investing involves risks including possible loss of principal. Any economic forecasts set forth may not develop as predicted and are subject to change.
References to markets, asset classes, and sectors are generally regarding the corresponding market index. Indexes are unmanaged statistical composites and cannot be invested into directly. Index performance is not indicative of the performance of any investment and do not reflect fees, expenses, or sales charges. All performance referenced is historical and is no guarantee of future results.
Any company names noted herein are for educational purposes only and not an indication of trading intent or a solicitation of their products or services. LPL Financial doesn’t provide research on individual equities.
All information is believed to be from reliable sources; however, LPL Financial makes no representation as to its completeness or accuracy.
US Treasuries may be considered “safe haven” investments but do carry some degree of risk including interest rate, credit, and market risk. Bonds are subject to market and interest rate risk if sold prior to maturity. Bond values will decline as interest rates rise and bonds are subject to availability and change in price.
The Standard & Poor’s 500 Index (S&P500) is a capitalization-weighted index of 500 stocks designed to measure performance of the broad domestic economy through changes in the aggregate market value of 500 stocks representing all major industries.
The PE ratio (price-to-earnings ratio) is a measure of the price paid for a share relative to the annual net income or profit earned by the firm per share. It is a financial ratio used for valuation: a higher PE ratio means that investors are paying more for each unit of net income, so the stock is more expensive compared to one with lower PE ratio.
Earnings per share (EPS) is the portion of a company’s profit allocated to each outstanding share of common stock. EPS serves as an indicator of a company’s profitability. Earnings per share is generally considered to be the single most important variable in determining a share’s price. It is also a major component used to calculate the price-to-earnings valuation ratio.
All index data from FactSet.
Value investments can perform differently from the market as a whole. They can remain undervalued by the market for long periods of time.
The prices of small cap stocks are generally more volatile than large cap stocks.
International investing involves special risks such as currency fluctuation and political instability and may not be suitable for all investors. These risks are often heightened for investments in emerging markets.
LPL Financial does not provide investment banking services and does not engage in initial public offerings or merger and acquisition activities.
This research material has been prepared by LPL Financial LLC.
Securities and advisory services offered through LPL Financial (LPL), a registered investment advisor and broker-dealer (member FINRA/SIPC). Insurance products are offered through LPL or its licensed affiliates. To the extent you are receiving investment advice from a separately registered independent investment advisor that is not an LPL affiliate, please note LPL makes no representation with respect to such entity.
Not Insured by FDIC/NCUA or Any Other Government Agency | Not Bank/Credit Union Deposits or Obligations | Not Bank/Credit Union Guaranteed | May Lose Value
RES-0001329-0524 | For Public Use | Tracking #586288 (Exp. 06/2025)