Of course, last week’s headliner was Jerome Powell and the Federal Reserve (Fed) cutting rates by a half percent on Wednesday, September 18, the first time since the COVID-19 pandemic broke out in 2020. The Fed “pause” ended at 423 days and now stands as the second-longest on record, while the 26% gain for the S&P 500 during the pause (7/27/23–9/18/24) ranks first. Here we share some thoughts on the Fed’s move last week and some potential market implications of not only Fed policy but also fiscal policy post-election.
It’s Not How You Drive, It’s How You Arrive
Golfers may appreciate this mantra as representing the importance of the final putt that goes in the hole as being the most important thing, more so than a well-struck first shot off the tee. We think this analogy works for the Fed here. While the 0.25% vs. 0.50% debate was all the rage, what matters most is how much Powell and company cut for the entire cycle and how lower rates affect the economy. Whether the cycle starts with a quarter or half-point cut isn’t as important given the Fed will almost certainly have to cut much more than that this cycle. (For those who appreciate NASCAR more than golf, call it a pit stop on the way to the more important finish line.)
We don’t know how much the Fed will end up cutting, but if they are able to engineer a soft landing — and last week’s rally sure suggests the market thinks that’s what we’ll get — then perhaps they end up stopping before they get to 3% (the upper bound now sits at 5%, down from 5.5%). The Fed and most analysts think the neutral rate is around 3%, or potentially a bit higher. Either way, based on the 1995 experience, that sets up a favorable environment for stock investors. After the initial cut in July 1995, the S&P 500 rallied 18.7% over the next 12 months.
Stocks Have Performed Well After Initial Fed Rate Cuts, if Recession Is Avoided
S&P 500 Performance After Initial Fed Rate Cuts
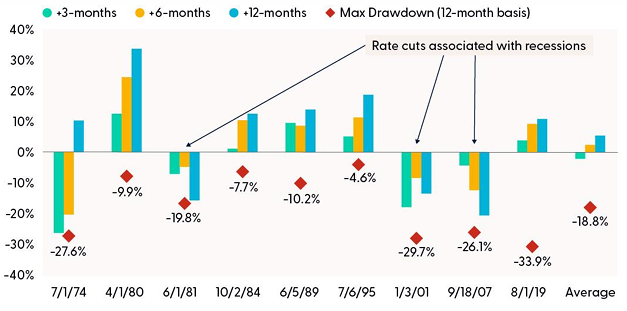
Source: LPL Research, Bloomberg 09/18/24
Disclosures: Indexes are unmanaged and cannot be invested in directly. Past performance is no guarantee of future results.
What you will notice in the accompanying chart is that stocks have done well historically after initial Fed cuts into soft landings, such as in 1995. To the contrary, the stock market has done poorly after initial rate cuts that were soon followed by recessions, such as 2001 and 2007.
We don’t know yet if this landing will be soft, though the Fed and markets are telling us it will be. It’s reasonable to think some doubt will creep in if the economy slows as we anticipate.
As Central Bank Risk Ebbs, Election Risk May Intensify
Now that the 0.25% vs. 0.50% debate has been settled, policy discussions are shifting toward the upcoming presidential election. In our Midyear Outlook 2024: Still Waiting for the Turn, we expressed our belief that volatility would likely increase in the second half, potentially around election-related policy uncertainty (geopolitical threats or an unexpected reacceleration in inflation were also cited as risks). We still hold this viewpoint, though inflation risks appear well contained at this point.
Stocks tend to be more volatile during election years, particularly within the three-month window before Election Day, as the accompanying chart illustrates. The CBOE Volatility Index (VIX) measure of implied market volatility (based on prices for index options) typically rises at this time of year, but the increase in volatility is more pronounced during election years.
Market Volatility Will Likely Increase Ahead of the Election
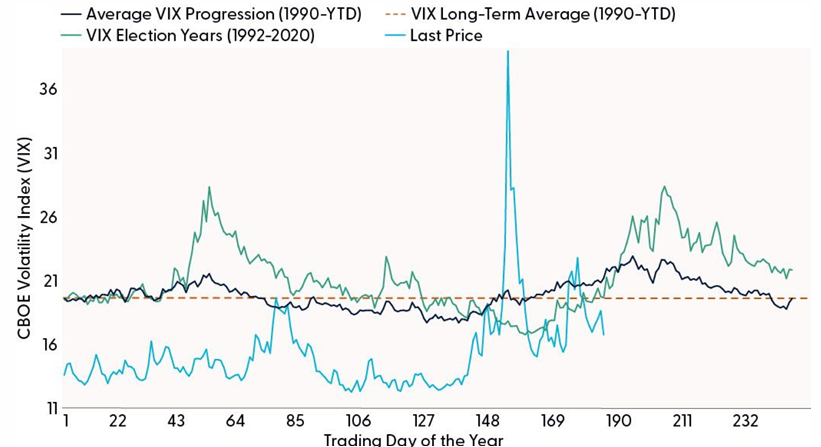
Source: LPL Research, Bloomberg, 09/19/24
Disclosures: All indexes are unmanaged and cannot be invested into directly. Past performance is no guarantee of future results.
The swings don’t usually prevent stocks from going higher during election years, as they will likely do in 2024. In fact, during election years the S&P 500 Index is higher 83% of the time, and higher by an average of 12.2% when positive. So, while a strong stock market during an election year is quite common, as we have experienced in 2024, a pullback is to be expected, and we would not suggest a typical 60–40 investor add to equities here.
Stocks as an Election Predictor
It’s hard to mention policy and the election without referencing one of the stock market’s more popular and accurate election predictors. Historically, the stock market has been a surprisingly accurate and unbiased election forecaster. Since 1928, if the S&P 500 was positive in the three months leading up to an election, the incumbent party remained in control of the White House 80% of the time (12 of 15 elections). Conversely, a declining market in the same period usually signaled a loss for the incumbent —occurring in eight of the last nine elections.
The S&P 500’s roughly 10% gain since August 5 suggests a Harris victory is more likely (as does the misery index, the sum of unemployment and inflation, which has fallen below 7%). This stock market pattern has predicted 20 out of the last 24 elections — a pretty good track record. However, the unpredictability of this election season, the incorrect prediction in 2020, and the fact that the incumbent party switched candidates, all suggest we should be cautious about relying on these historical patterns. The latest polls in swing states suggest the race is close (and no, this is not a prediction in any way).
Stocks Have an Impressive Track Record of Predicting Elections
S&P 500 Index Returns Three Months Before the Presidential Election
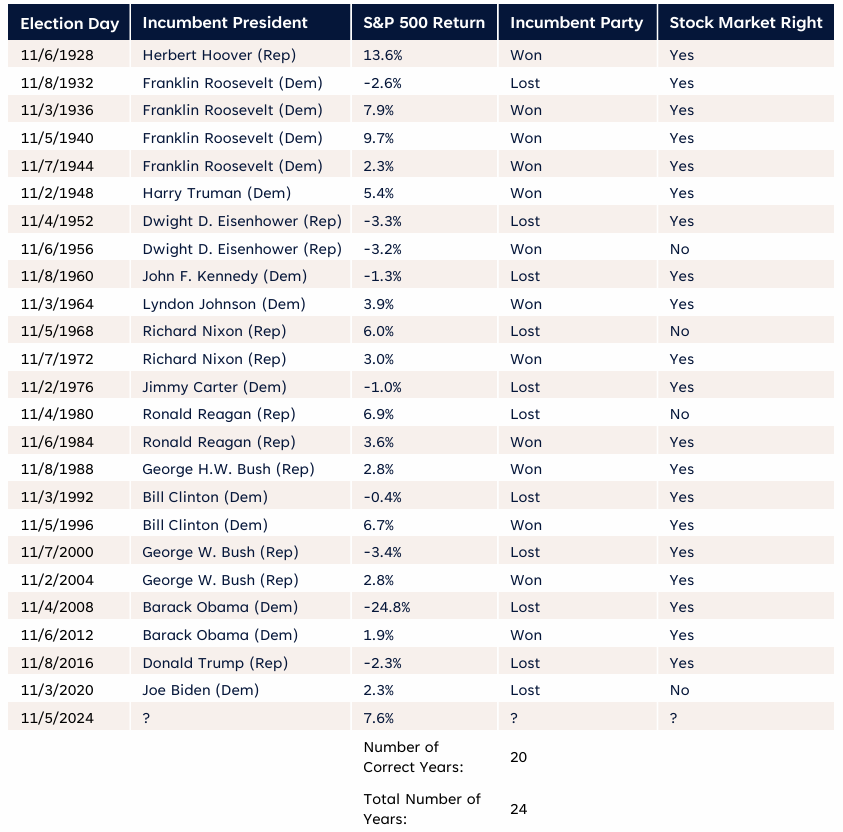
Source: LPL Research, FactSet 09/19/24
All indexes are unmanaged and cannot be invested into directly. Past performance is no guarantee of future results.
The modern design of the S&P 500 stock index was first launched in 1957. Performance back to 1950 incorporates the performance of the predecessor index, the S&P 90.
What Sectors Might Be Potential Winners and Losers Depending on the Election Outcome
We often get the question of what industries or sectors might do better under Republican or Democratic leadership. As a result of some of the potential policy differences, there could likely be market “winners and losers,” depending on who stands as president in 2025, as illustrated in the accompanying table. Note: The potential winners for each candidate highlighted below, would perhaps be more likely or more definitive should that candidate’s party also control the House and/or Senate.
Of the potential winners below, we believe renewable energy/electric vehicles (EV) and Medicaid-exposed insurers may be the most likely beneficiaries in a Harris administration, while U.S. steelmakers and oil and gas could be the most likely beneficiaries in a Trump administration. On the downside, a Trump administration may be the most detrimental to China’s economy and its companies, while a Harris administration would perhaps weigh the most heavily on the traditional oil and gas segment. LPL Research will be providing much more on the election in the weeks ahead.
Winner of U.S. Presidential Election
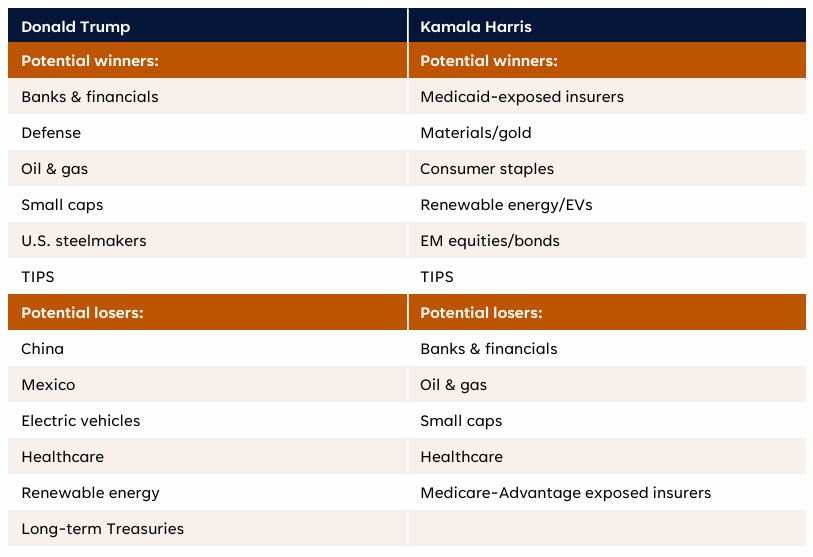
Source: LPL Research, Evercore ISI 07/30/24
Disclosures: Forecast may not materialize as predicted.
Asset Allocation Insights
LPL’s Strategic and Tactical Asset Allocation Committee (STAAC) maintains its neutral stance on equities, though, with a slightly negative bias in the very short term based on the technical setup near record highs on the S&P 500, historical seasonal weakness, and political and geopolitical uncertainty. The Committee expects volatility to remain elevated in the coming months as the market waits for more clarity on the economy, elections, and a better seasonal setup. For fixed income, the STAAC recommends a modest overweight, funded from cash, with an up-in-quality approach and benchmark level interest rate sensitivity.
Important Disclosures
This material is for general information only and is not intended to provide specific advice or recommendations for any individual. There is no assurance that the views or strategies discussed are suitable for all investors or will yield positive outcomes. Investing involves risks including possible loss of principal. Any economic forecasts set forth may not develop as predicted and are subject to change.
References to markets, asset classes, and sectors are generally regarding the corresponding market index. Indexes are unmanaged statistical composites and cannot be invested into directly. Index performance is not indicative of the performance of any investment and do not reflect fees, expenses, or sales charges. All performance referenced is historical and is no guarantee of future results.
Any company names noted herein are for educational purposes only and not an indication of trading intent or a solicitation of their products or services. LPL Financial doesn’t provide research on individual equities.
All information is believed to be from reliable sources; however, LPL Financial makes no representation as to its completeness or accuracy.
All investing involves risk, including possible loss of principal.
US Treasuries may be considered “safe haven” investments but do carry some degree of risk including interest rate, credit, and market risk. Bonds are subject to market and interest rate risk if sold prior to maturity. Bond values will decline as interest rates rise and bonds are subject to availability and change in price.
Municipal bonds are subject to availability and change in price. They are subject to market and interest rate risk if sold prior to maturity. Bond values will decline as interest rates rise. Interest income may be subject to the alternative minimum tax. Municipal bonds are federally tax-free but other state and local taxes may apply. If sold prior to maturity, capital gains tax could apply.
All index data from FactSet and Bloomberg.
This research material has been prepared by LPL Financial LLC.
Securities and advisory services offered through LPL Financial (LPL), a registered investment advisor and broker-dealer (member FINRA/SIPC). Insurance products are offered through LPL or its licensed affiliates. To the extent you are receiving investment advice from a separately registered independent investment advisor that is not an LPL affiliate, please note LPL makes no representation with respect to such entity.
Not Insured by FDIC/NCUA or Any Other Government Agency | Not Bank/Credit Union Guaranteed | Not Bank/Credit Union Deposits or Obligations | May Lose Value
For public use.
Member FINRA/SIPC.
RES-0001819-0824W Tracking # 633595 (Exp. 09/25