On October 12, 2022, there were very few comments suggesting that a new bull market was in the throes of being born as the S&P 500 opened at 3,590.83 and closed at 3,577.03.
After all, inflation was still running hot even though the Federal Reserve (Fed) began its rate-hiking campaign on March 16, 2022, by raising rates by 25 basis points (0.25%) and moving to a 50-basis point hike on May 5, 2022, as it tried to quell inflationary pressures. By mid-June, a series of 75 basis-point hikes were introduced as the Consumer Price Index (CPI) peaked in June at 9.1%.
The October 13 rally that ended the bear market at a low of 3,577.03 began with the S&P 500 selling off in the morning only to rally dramatically higher into the market close. The CPI report earlier in the day showed headline inflation at 8.2% on a year-over-year basis, but Core CPI ─ not including food and fuel prices ─ beat the consensus estimate at 6.6%. The S&P 500 closed at 3,669.91 and the bull market had commenced.
The Bear Gives Way to the Bull
The explanations for the market reversal that day traversed from excessive short covering to the deep pessimism embedded in the market psyche that allowed investors and traders alike to witness a modicum of improvement in the CPI report.
S&P 500 Maintains Its Growth Over the Last Year
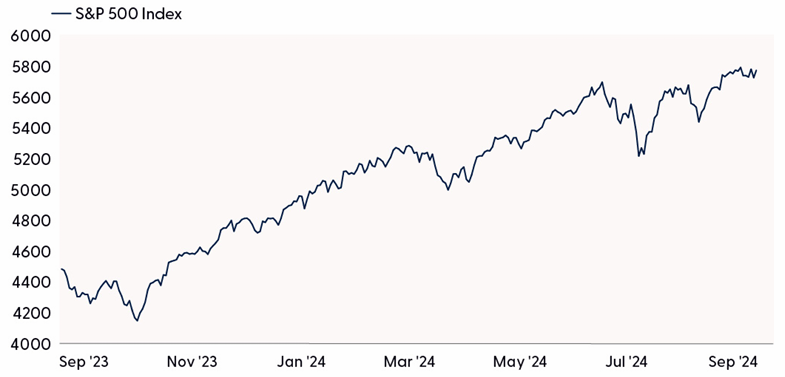
Source: LPL Research, Bloomberg 10/8/24
Disclosures: All Indexes are unmanaged and cannot be invested in to directly. Past Performance is no guarantee of future results.
Can the Bull Continue to Run Higher?
From the October 12, 2022, low to its two-year anniversary, the S&P 500 has gained approximately 60%, and with the preponderance of gains accumulated in 2024 coupled with higher valuations, there are concerns that with geopolitical risks rising, markets could face bouts of serious volatility.
Geopolitical risks, while escalating, have remained regionally based thus far, allowing the S&P 500 to focus on earnings momentum. International diplomatic efforts continue in the Middle East as well as in Europe with an effort towards ending the Russia-Ukraine conflict with a negotiated settlement.
In addition, there’s a focus on election year “uncertainty” rather than the “certainty” the market historically enjoys once the election is over, and the market concludes the year during the most hospitable period in terms of seasonality.
The first year of the bull run had many questioning the legitimacy of the “bull” characterization because the rally was “only” 20%, considerably less than what is typically associated with the excitement of a new bull market. The second year’s gains, however, of about 33% certainly confirmed that the bull market is intact.
With the broad compendium of data, the third year typically sees lower, but still positive returns. More on that below.
Strong S&P 500 Appreciation Over the Last Two Years
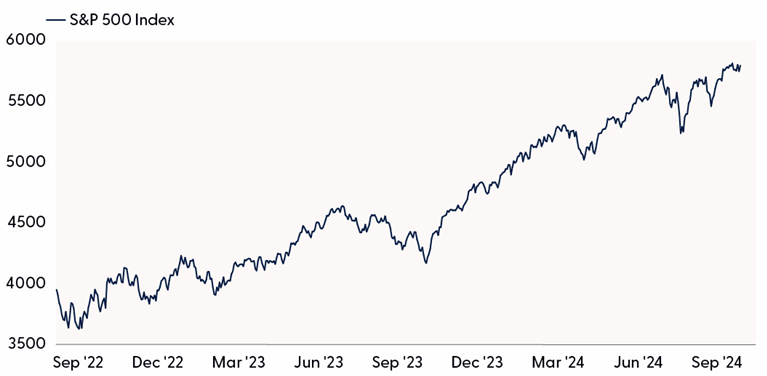
Source: LPL Research, Bloomberg 10/8/24
Disclosures: All Indexes are unmanaged and cannot be invested in to directly. Past Performance is no guarantee of future results.
What Does the Bull Require to Continue?
The debate over the strength of the underlying economic backdrop continues, but the data suggests that while economic growth has eased from being stellar to solid, recession fears have been alleviated. Moreover, the Fed appears poised to continue lowering rates if the disinflationary trend continues on pace.
Corporate earnings are expected to rise, with operating margins remaining at a healthy level. Consumer spending continues to edge higher, albeit with consumers increasingly careful and discerning. With the Fed’s commitment towards its maximum employment mandate, it’s expected that the Fed will lower rates at a more aggressive pace should the labor market indicate signs of deterioration, helping to cushion overall economic weakness and help underpin consumer sentiment.
The Fed’s path towards a soft landing has also supported the bull market thesis, although the Fed has acknowledged that the path towards declaring victory on bringing inflation closer to its “price stability” mandate could be “bumpy.”
The concentration of strong returns has been most closely aligned with so-called “hyperscalers” within the technology sector. These include Microsoft (MSFT), Alphabet (GOOG/L), Meta (META), Amazon (AMZN), and Apple (AAPL). Although typically identified as mega-tech companies that offer cloud computing resources to large enterprises, it increasingly involves incorporating generative AI infrastructure into its operating systems.
While the infrastructure companies, e.g., NVIDIA (NVDA), have been the beneficiaries of evolving AI technology, investors are requiring the “monetization” of the higher costs for the generative AI semiconductor chips, and with high valuations attached to the technology sector, there are questions regarding whether companies deliver results quickly enough to validate the valuations. LPL Research’s Strategic and Tactical Asset Allocation Committee maintains a neutral stance on the technology sector.
How Do Bull Markets Die?
It is an integral part of market theology that bull markets do not die of old age. Recessions, climbing interest rates, exogenous shocks, poor earnings, and geopolitical scenarios that are no longer contained can conspire to kill off the bull.
We can expect that the bull entering the third year will need to maneuver around volatility, lack of certainty, and a host of other obstacles, but since the end of World War II, most bull markets that made it through their second year have gone on to enjoy a third year, albeit with lower returns.
Year-By-Year Returns For Bull Markets
S&P 500 Index Bull Markets (1950 -Current)
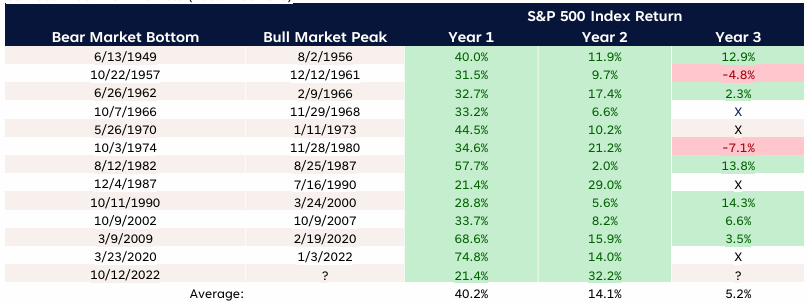
Source: LPL Research, FactSet 10/10/24
Disclosures: All indexes are unmanaged and cannot be invested into directly. Past performance is no guarantee of future results.
The modern design of the S&P 500 Index was first launched in 1957.
Performance before then incorporates the performance of its predecessor index, the S&P 90.
There’s no compelling reason that this bull should surrender to the always lurking bear, especially with an accommodative Federal Reserve, solid economic underpinning, and an earnings outlook poised for stable growth. The election will come and go with a new occupant in the White House, which historical patterns suggest doesn’t affect the market in either direction.
Taken together, the bull’s second birthday present augurs well for another year.
Solid Gains for the S&P 500 Over the Three-Year Period
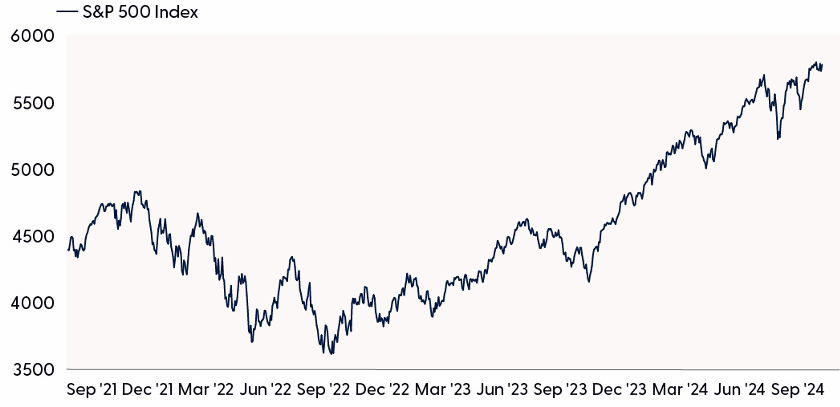
Source: LPL Research, Bloomberg 10/8/24
Disclosures: All Indexes are unmanaged and cannot be invested in to directly. Past Performance is no guarantee of future results.
Asset Allocation Insights
LPL’s Strategic and Tactical Asset Allocation Committee (STAAC) maintains its tactical neutral stance on equities while acknowledging the likelihood of short-term weakness, especially as geopolitical threats in the Middle East escalate and the approaching U.S. presidential election introduces policy uncertainty. Equities must also readjust to what we expect will be a slower and shallower Fed rate-cutting cycle than markets are currently pricing in, although both post-election and fourth-quarter seasonality are favorable for stocks.
Important Disclosures
This material is for general information only and is not intended to provide specific advice or recommendations for any individual. There is no assurance that the views or strategies discussed are suitable for all investors or will yield positive outcomes. Investing involves risks including possible loss of principal. Any economic forecasts set forth may not develop as predicted and are subject to change.
References to markets, asset classes, and sectors are generally regarding the corresponding market index. Indexes are unmanaged statistical composites and cannot be invested into directly. Index performance is not indicative of the performance of any investment and do not reflect fees, expenses, or sales charges. All performance referenced is historical and is no guarantee of future results.
Any company names noted herein are for educational purposes only and not an indication of trading intent or a solicitation of their products or services. LPL Financial doesn’t provide research on individual equities.
All information is believed to be from reliable sources; however, LPL Financial makes no representation as to its completeness or accuracy.
All investing involves risk, including possible loss of principal.
US Treasuries may be considered “safe haven” investments but do carry some degree of risk including interest rate, credit, and market risk. Bonds are subject to market and interest rate risk if sold prior to maturity. Bond values will decline as interest rates rise and bonds are subject to availability and change in price.
The Standard & Poor’s 500 Index (S&P500) is a capitalization-weighted index of 500 stocks designed to measure performance of the broad domestic economy through changes in the aggregate market value of 500 stocks representing all major industries.
The PE ratio (price-to-earnings ratio) is a measure of the price paid for a share relative to the annual net income or profit earned by the firm per share. It is a financial ratio used for valuation: a higher PE ratio means that investors are paying more for each unit of net income, so the stock is more expensive compared to one with lower PE ratio.
Earnings per share (EPS) is the portion of a company’s profit allocated to each outstanding share of common stock. EPS serves as an indicator of a company’s profitability. Earnings per share is generally considered to be the single most important variable in determining a share’s price. It is also a major component used to calculate the price-to-earnings valuation ratio.
All index data from Bloomberg.
This research material has been prepared by LPL Financial LLC.
Securities and advisory services offered through LPL Financial (LPL), a registered investment advisor and broker-dealer (member FINRA/SIPC). Insurance products are offered through LPL or its licensed affiliates. To the extent you are receiving investment advice from a separately registered independent investment advisor that is not an LPL affiliate, please note LPL makes no representation with respect to such entity.
Not Insured by FDIC/NCUA or Any Other Government Agency | Not Bank/Credit Union Guaranteed | Not Bank/Credit Union Deposits or Obligations | May Lose Value
For public use.
Member FINRA/SIPC.
RES-0001819-0824W Tracking # 643724 (Exp. 10/24)